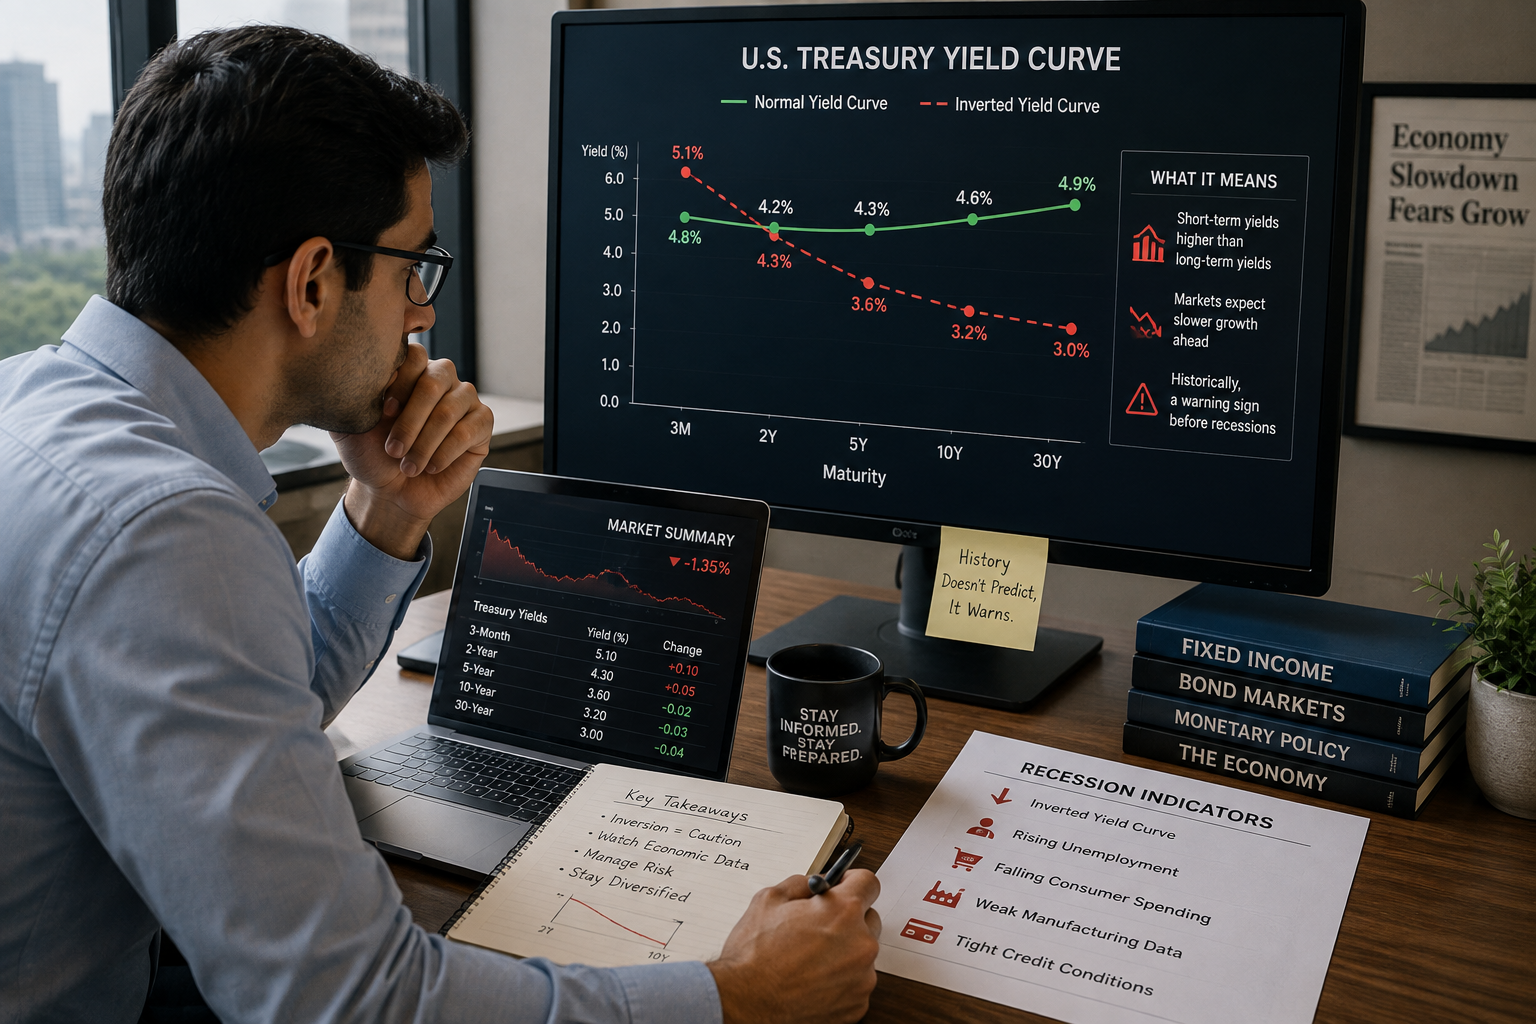
When the bond market starts speaking in warning signals
An inverted yield curve sounds technical, but the idea is simple. It describes a moment when short-term bonds offer higher yields than long-term bonds of similar credit quality. In normal conditions, investors usually expect a higher yield for lending money for ten years than for lending it for three months or two years. Longer time means more uncertainty. Inflation may change. Central banks may change policy. Governments may borrow more. Markets may shift. So investors normally demand extra compensation for locking money away for longer.
An inversion flips that logic. Short-term yields move above long-term yields. The line that usually slopes upward begins to slope downward. This is why the phrase attracts attention in financial markets. It suggests that investors may expect today's high short-term rates to fall in the future, often because economic growth may weaken and central banks may eventually cut rates. The inverted curve is not a prophecy, but it is a serious market signal.
What a yield curve normally shows
A yield curve plots bond yields across different maturities. If we look at government bonds, the curve may include three-month bills, one-year securities, two-year bonds, five-year bonds, ten-year bonds and thirty-year bonds. The horizontal axis shows maturity. The vertical axis shows yield. The shape of the curve tells us how markets price time, risk, inflation and monetary policy.
A normal curve slopes upward. Short-term bonds yield less and long-term bonds yield more. A flat curve means short and long maturities offer similar yields. An inverted curve slopes downward. Short-term yields are higher than long-term yields.
This shape matters because government bond yields influence the wider economy. Corporate loans, bank lending, mortgages, valuation models and debt mutual funds all take signals from sovereign yield curves. When the curve changes shape, it is not only bond traders who should notice. Borrowers, savers, banks, policymakers and investors all feel the consequences.
Why the curve inverts
The curve usually inverts when short-term interest rates rise sharply while long-term yields do not rise as much, or even fall. The most common reason is central bank tightening. If inflation is high, a central bank raises policy rates. Short-term bond yields follow because they are closely linked to current and expected near-term policy rates. But long-term yields reflect expectations about many years ahead. If investors believe high rates will slow the economy, reduce inflation and force future rate cuts, they may buy long-term bonds. That demand pushes long-term bond prices up and long-term yields down.
In other words, the short end of the curve reflects current monetary pressure, while the long end may reflect future economic weakness. That tension creates inversion.
Safe-haven demand can deepen the inversion. During periods of uncertainty, investors may prefer long-term government bonds because they are seen as safer than risky assets. Pension funds, insurers and foreign reserve managers may also buy long-duration bonds for structural reasons. These flows can suppress long-term yields even when short-term rates remain high.
Why markets link inversion with recession risk
An inverted yield curve has historically been watched as a recession warning, especially in the United States. The reason is economic logic. When central banks keep short-term rates high to control inflation, borrowing becomes more expensive. Companies may delay investment. Households may reduce credit spending. Banks may become more cautious. Asset prices may weaken. If tighter money continues for long enough, growth can slow.
At the same time, long-term investors may begin to expect that the slowdown will eventually force the central bank to cut rates. They accept lower yields on long-term bonds because they expect future rates to be lower than current rates. The curve therefore captures a market expectation: monetary policy may be restrictive today because inflation is a problem, but the economy may be weaker tomorrow.
This is why institutions such as the New York Fed have long used the term spread, or the slope between long-term and short-term Treasury yields, as an input for estimating recession probability. The signal is not perfect, but it is influential because it comes from market prices rather than opinion polls.
Why the signal is useful but not automatic
The biggest mistake is to treat every inversion as a mechanical countdown to recession. The bond market is powerful, but it is not an oracle. Yield curves can invert for reasons that are partly technical. Central bank bond purchases, regulatory demand for safe assets, pension-fund flows, global savings patterns, dollar liquidity, foreign reserve accumulation and risk-aversion can all influence long-term yields.
The timing is also uncertain. A curve may invert months before a slowdown. It may stay inverted for a long time. The economy may continue growing while markets debate what the signal means. In some cases, the curve may normalise not because the economy has become healthy, but because short-term rates fall during stress.
Therefore, an inverted curve should be read as a warning sign, not a guarantee. It belongs inside a broader dashboard: credit growth, unemployment, corporate earnings, bank lending, inflation, real wages, consumer demand, housing activity and global shocks. A serious analyst reads the curve together with the economy, not in isolation.
What inversion means for banks and credit
Banks are sensitive to the yield curve because a traditional banking model involves borrowing short and lending long. Banks take deposits and short-term funding, then make longer-term loans. When long-term rates are comfortably above short-term funding costs, lending margins can be healthier. When the curve flattens or inverts, that spread can narrow.
This does not mean every bank immediately becomes weak. Banks earn income from many activities, and their actual funding costs depend on deposits, competition, asset mix and regulation. But a persistent inversion can make the credit environment tighter. Banks may become selective. Borrowers may face stricter standards. Credit creation may slow.
That is one reason the curve has real economic power. It does not only predict conditions; it can help transmit them. If banks reduce risk-taking because the curve makes lending less attractive, the financial system itself can contribute to slower growth.
What it means for investors
For bond investors, an inverted curve changes the reward for maturity. Short-term instruments may offer attractive yields with lower duration risk. Long-term bonds may offer capital gains if rates eventually fall, but they also carry price volatility if long-term yields rise. Debt mutual fund investors must understand this trade-off because duration can turn a bond portfolio from calm to volatile.
For equity investors, inversion can affect valuation psychology. If short-term safe assets offer high yields, risky assets must compete harder for investor capital. At the same time, recession fears can pressure corporate earnings expectations. Financial stocks may react differently depending on how the inversion affects margins and loan growth.
For ordinary savers, the lesson is not to trade the curve aggressively. The practical lesson is to understand that interest-rate products are connected. Fixed deposits, bonds, debt funds, home loans and pension portfolios all sit inside the same interest-rate environment.
The India angle
In India, the government securities curve is shaped by RBI policy expectations, inflation trends, fiscal borrowing, banking liquidity, foreign portfolio flows and global bond-market movements. India may not experience yield-curve signals in exactly the same way as the United States because its market structure, banking system, inflation dynamics and capital-flow conditions differ. But the principle remains useful: the shape of the curve tells us how the market is pricing time and risk.
For Indian readers, an inverted curve should be understood as part of a larger financial literacy map. It helps explain why deposit rates, bond fund returns and borrowing costs do not all move together in a straight line. It also shows why central bank policy affects not only headlines but household financial decisions.
Final takeaway
An inverted yield curve matters because it compresses a difficult economic story into one visible line. It tells us that markets may believe short-term policy is tight while future growth and rates could be lower. That is why it is watched as a recession warning.
But the signal must be treated with discipline. It is not destiny. It is not a stock-market trading rule. It is not proof that a recession will begin on a fixed date. It is a warning that the relationship between money, time and risk has changed.
The intelligent response is neither panic nor dismissal. The intelligent response is interpretation. Ask why short-term yields are high. Ask why long-term yields are lower. Ask what credit markets, banks, inflation and employment are saying. The curve gives the first clue. The economy gives the full story.
Disclaimer
This article is for educational and editorial purposes only. It is not investment advice, bond trading advice, debt mutual fund advice or a recommendation to buy or sell any security. Yield curves change with market conditions and should be interpreted with professional guidance where money decisions are involved.