Two countries can have the same average income and still feel like completely different societies. In one, most people may live around the middle, with modest differences between rich and poor. In another, a small elite may control a large share of income while millions struggle near the bottom. Average income alone cannot reveal this difference. The Gini coefficient exists because distribution matters.
The Gini coefficient, often expressed as the Gini index, is one of the most widely used measures of inequality. It tries to answer a simple but politically powerful question: how equally is income or consumption distributed across a population? A society with perfect equality would have a Gini value of 0. A society where one person has everything and everyone else has nothing would approach 1, or 100 when expressed as an index. Real countries fall between these extremes.
The Gini coefficient is important because inequality shapes opportunity, social trust, political stability, consumer demand, public health, education outcomes and the legitimacy of economic growth. A country may grow fast, but if growth is captured by a narrow section, citizens may not experience development. The Gini coefficient is not the only measure of inequality, but it gives readers a starting point for asking whether prosperity is broadly shared.
How the Gini Coefficient Works
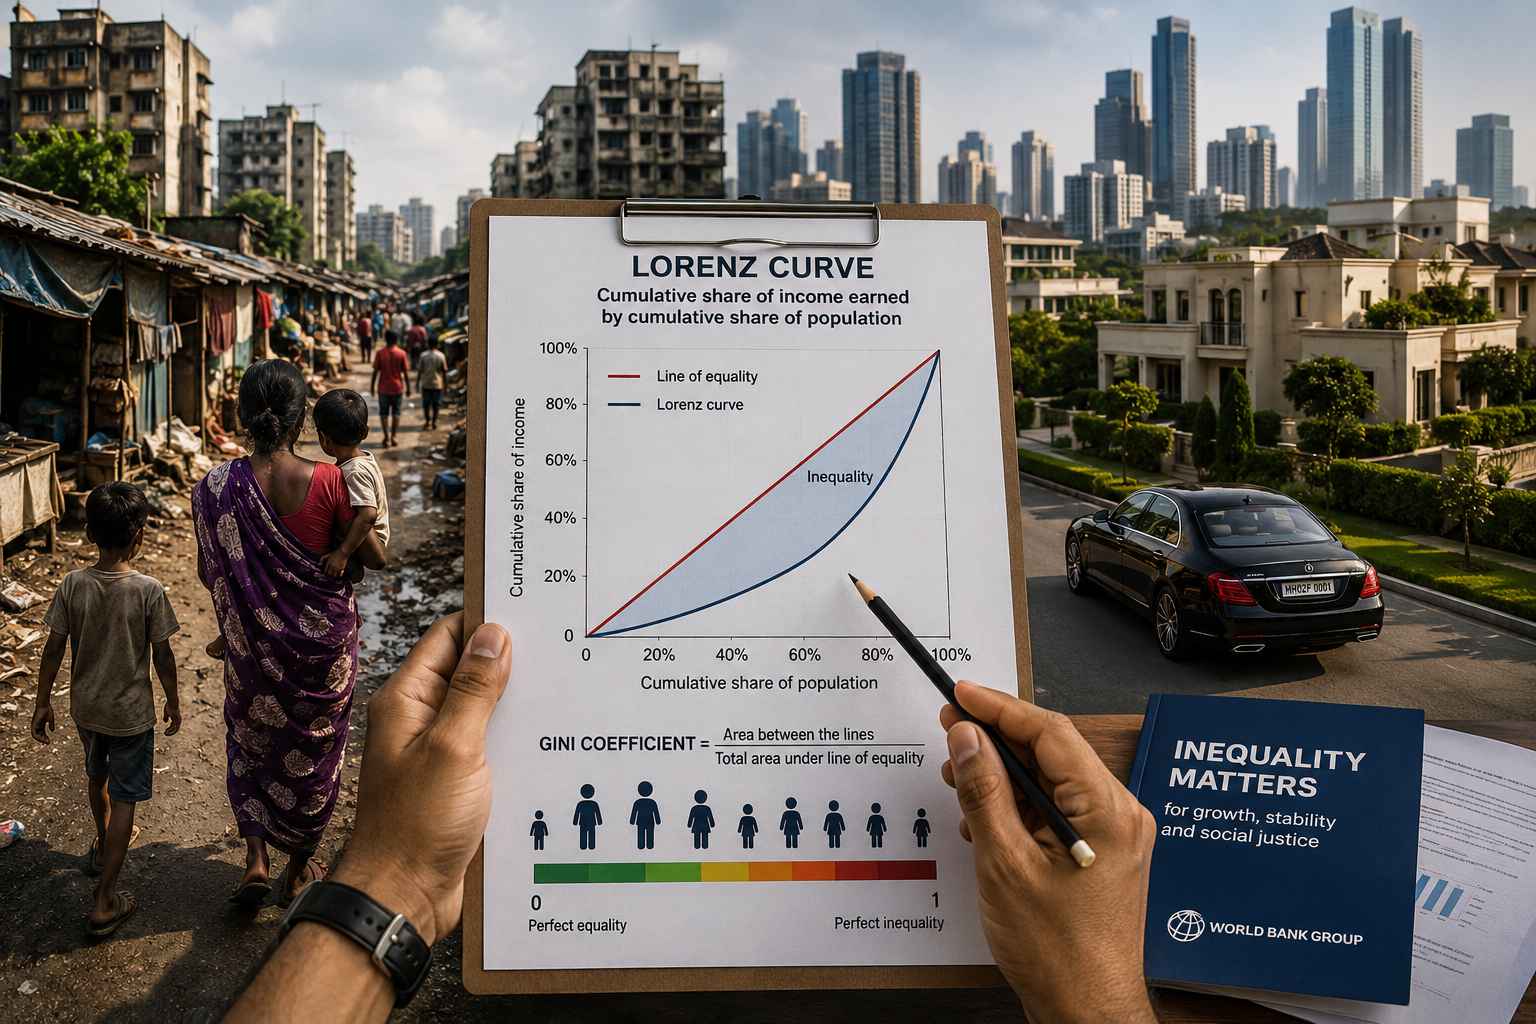
The Gini coefficient is linked to the Lorenz curve. Imagine lining up every household in a country from poorest to richest and then measuring the cumulative share of income they receive. In a perfectly equal society, the poorest 10 percent would receive 10 percent of income, the poorest 50 percent would receive 50 percent, and so on. This would create a straight line of perfect equality.
In reality, income is unequal. The poorest 50 percent may receive far less than 50 percent of total income, while the richest groups receive more. The Lorenz curve shows this gap. The Gini coefficient measures the area between the line of perfect equality and the actual Lorenz curve. The larger the gap, the higher the inequality.
This sounds technical, but the intuition is straightforward. The Gini coefficient compresses the shape of income distribution into one number. A lower number suggests a more equal distribution. A higher number suggests a more unequal distribution. The measure is popular because it is compact, comparable and easy to communicate.
Income Inequality vs Wealth Inequality
One of the most important distinctions is between income inequality and wealth inequality. Income refers to money received over a period, such as wages, salaries, business profits, rent, interest, dividends or transfers. Wealth refers to accumulated assets such as land, homes, shares, gold, businesses, savings and inherited property minus liabilities.
Wealth inequality is often much higher than income inequality because assets accumulate over generations. A person with moderate income but inherited property may be wealthier than a person with a higher salary and no assets. A business owner may have fluctuating income but large net worth. A salaried worker may have stable income but little ownership of productive assets.
Many Gini figures reported in public databases refer to income or consumption inequality, not total wealth inequality. This matters because a low income Gini does not automatically mean wealth is equally distributed. Land ownership, housing, financial assets and business equity can be concentrated even when reported income or consumption looks relatively balanced.
Income, Consumption and Measurement Choices
Gini estimates depend heavily on what is being measured. Some countries measure income. Others measure consumption or expenditure. Consumption inequality can be lower than income inequality because households smooth spending through savings, borrowing, family support or government transfers. Income data can be difficult to capture accurately, especially among the self-employed, informal workers and high-income households.
Survey design also matters. If a household survey misses very rich households, inequality may be understated. If informal income is underreported, the picture may be distorted. If consumption is measured instead of income, the result may show a different distribution. This is why inequality statistics require methodological caution.
A Gini number should therefore never be read without asking: inequality of what, measured how, in which year, from which survey, before or after taxes and transfers? These questions may seem technical, but they decide whether public debate is grounded or misleading.
Why Inequality Matters Economically
Inequality matters because it affects how growth is experienced. If most income gains go to the top, aggregate GDP may rise while mass purchasing power remains weak. This can reduce demand for basic goods, housing, education and services. A broader distribution of income can support more stable domestic consumption because lower and middle-income households tend to spend a larger share of income.
High inequality can also weaken social mobility. When wealth buys better schooling, healthcare, networks and safety, children born into richer families begin life with advantages that compound over time. Children born into poor households face disadvantages that also compound. The economy then wastes talent because ability is not matched with opportunity.
Inequality also affects financial stability. In some economies, stagnant middle-class incomes have encouraged households to borrow in order to maintain living standards. In others, concentrated wealth has flowed into asset markets, pushing up property or financial prices. Distribution is therefore not only a social issue; it is part of macroeconomic health.
Why Inequality Matters Politically
When citizens believe the economy is unfair, political trust weakens. People may accept unequal outcomes if they believe rules are fair, effort is rewarded and opportunity is open. But if they believe success depends mainly on inheritance, connections, monopoly power, corruption or policy capture, inequality becomes politically explosive.
High inequality can produce polarisation. The wealthy may demand lower taxes and better protection of assets, while the poor and middle class demand redistribution, subsidies and jobs. Political parties may exploit this divide. In extreme cases, inequality can weaken faith in democracy itself because citizens conclude that money controls policy.
This does not mean equality requires everyone to earn the same. A dynamic economy will have differences in income due to skill, effort, risk, innovation and entrepreneurship. The real question is whether inequality reflects productive contribution or structural exclusion. The Gini coefficient cannot answer that moral question alone, but it helps identify when the distribution problem deserves attention.
The India Context
India’s inequality debate is complex because the country has rapid growth, deep informality, regional diversity, caste and gender disparities, rural-urban differences and large variations in education and asset ownership. Income, consumption and wealth measures can tell different stories. Consumption surveys may show one pattern. Tax data, wealth reports and household asset studies may show another.
For India, inequality is not only about rich versus poor. It is also about access: who gets quality schooling, who receives affordable healthcare, who has safe housing, who owns land or financial assets, who enters formal jobs, who can migrate safely, who has digital access and who can withstand a shock without falling into debt.
This is why the Gini coefficient should be used alongside other indicators. Poverty rates, employment quality, rural wages, nutrition, school learning levels, health outcomes, women’s labour-force participation, wealth concentration and regional development all matter. Inequality in India is multidimensional. One number can begin the conversation, but it cannot finish it.
The Limits of the Gini Coefficient
The Gini coefficient has clear limitations. First, it does not show where inequality occurs. Two countries can have the same Gini value but very different distributions. One may have a large poor population and a small elite. Another may have a stretched middle class. The headline number hides the shape.
Second, it is less sensitive to changes at the extremes than some other measures. A major gain by the top 1 percent may not fully appear in a household survey-based Gini if the very rich are underrepresented. Third, it does not capture absolute living standards. A poor but equal country can have a low Gini; a rich but unequal country can have a higher Gini. Equality alone is not prosperity.
Fourth, it does not measure opportunity directly. A society may have moderate income inequality but low mobility because education and networks are unequal. Fifth, it does not capture wealth concentration unless wealth-specific data is used. For these reasons, Gini should be part of a dashboard, not the whole dashboard.
Policy Responses to Inequality
Governments can respond to inequality through several channels. Progressive taxation can raise revenue from those with greater capacity to pay. Social spending on health, education, nutrition and housing can expand opportunity. Labour policies can improve wages and working conditions. Competition policy can prevent monopoly power. Financial inclusion can help households access savings, credit and insurance. Infrastructure can reduce regional gaps.
But poorly designed redistribution can create inefficiency, leakage or dependency. The best inequality policy is not only redistribution after income is earned; it is pre-distribution through better education, health, skills, market access and fair competition. A society becomes more equal not just by transferring income, but by widening the capacity to earn, own and participate.
For India, this means combining growth with capability. Jobs, skills, public health, school quality, women’s economic participation, urban planning, rural productivity and asset ownership must be treated as inequality policy. The goal is not to punish success. The goal is to prevent birth, geography and social identity from deciding destiny.
How Readers Should Interpret Inequality Data
Readers should treat inequality data with discipline. First, check whether the number refers to income, consumption or wealth. Second, check whether it is before or after taxes and transfers. Third, check the year and data source. Fourth, compare trends, not just one snapshot. Fifth, use the Gini coefficient with other indicators such as poverty, median income, employment and wealth distribution.
The most misleading use of Gini is political cherry-picking. A low number can be used to declare that inequality is not a problem, while lived realities may reveal unequal access to quality services and assets. A high number can be used to demand extreme policy without understanding the causes. Good analysis avoids both complacency and panic.
Final Takeaway
The Gini coefficient is a powerful tool because it forces economics to ask who receives the gains of growth. It reminds us that averages can deceive. A rising national income matters, but distribution decides whether growth becomes shared progress.
At the same time, the Gini coefficient is not a complete diagnosis. It does not show every form of inequality, nor does it explain why inequality exists. Its real value is as an entry point. It opens the door to a deeper question that every serious economy must face: not only how much wealth is created, but how fairly opportunity, income and security are distributed across society.
Editorial Disclaimer
This article is for economic and public policy education only. Gini estimates differ by income, consumption, survey method and year, so country-specific figures should be verified from the latest official or World Bank data before publication.