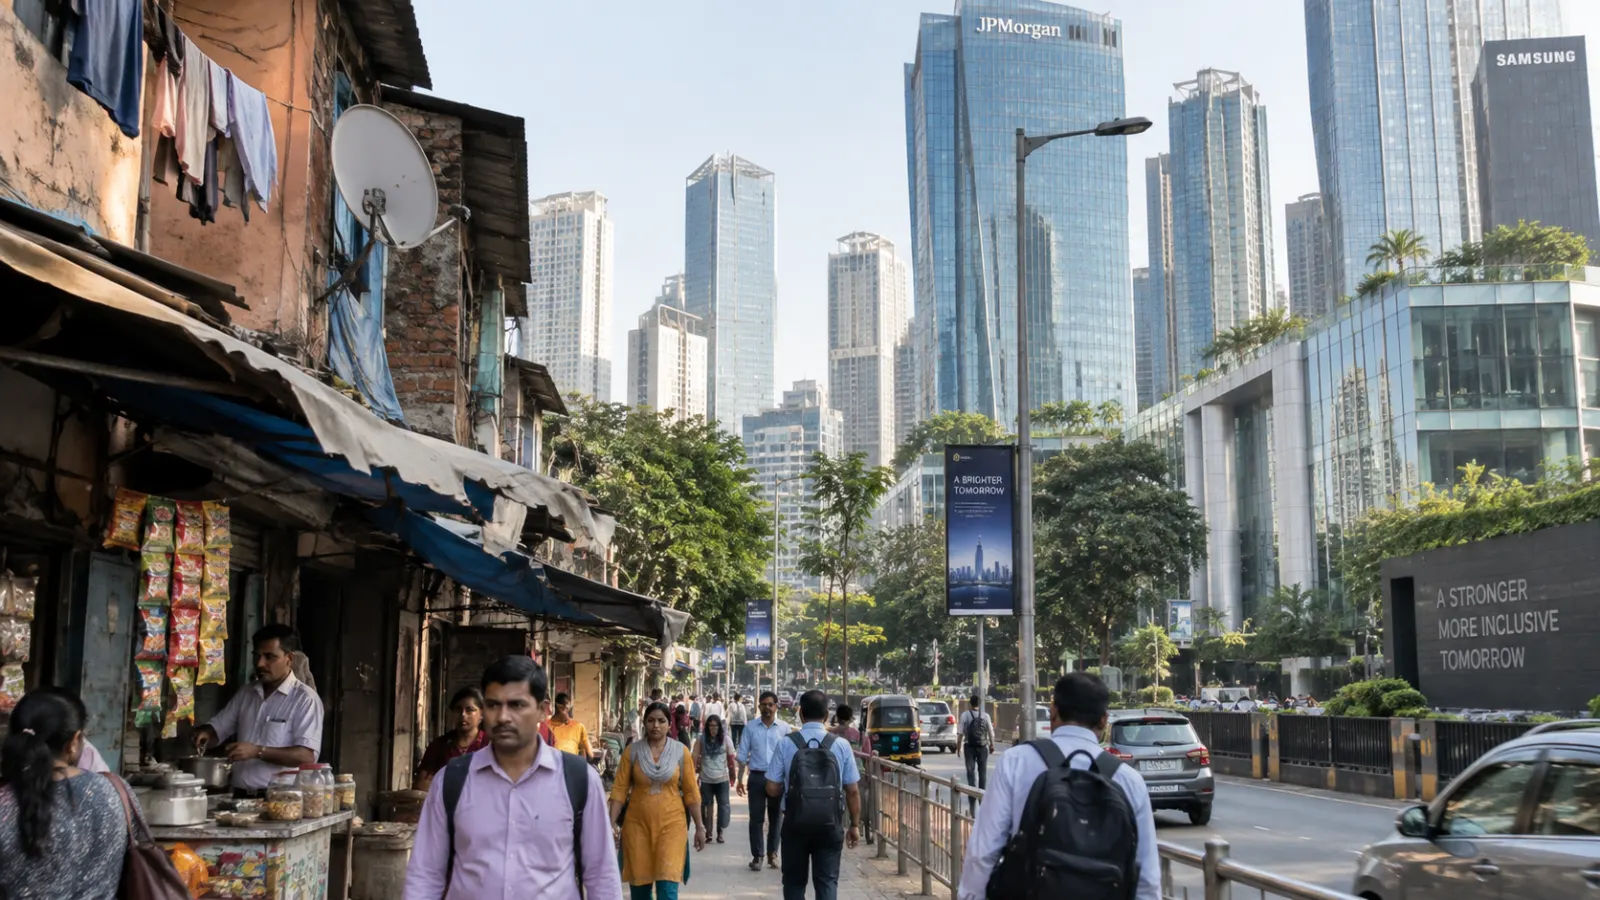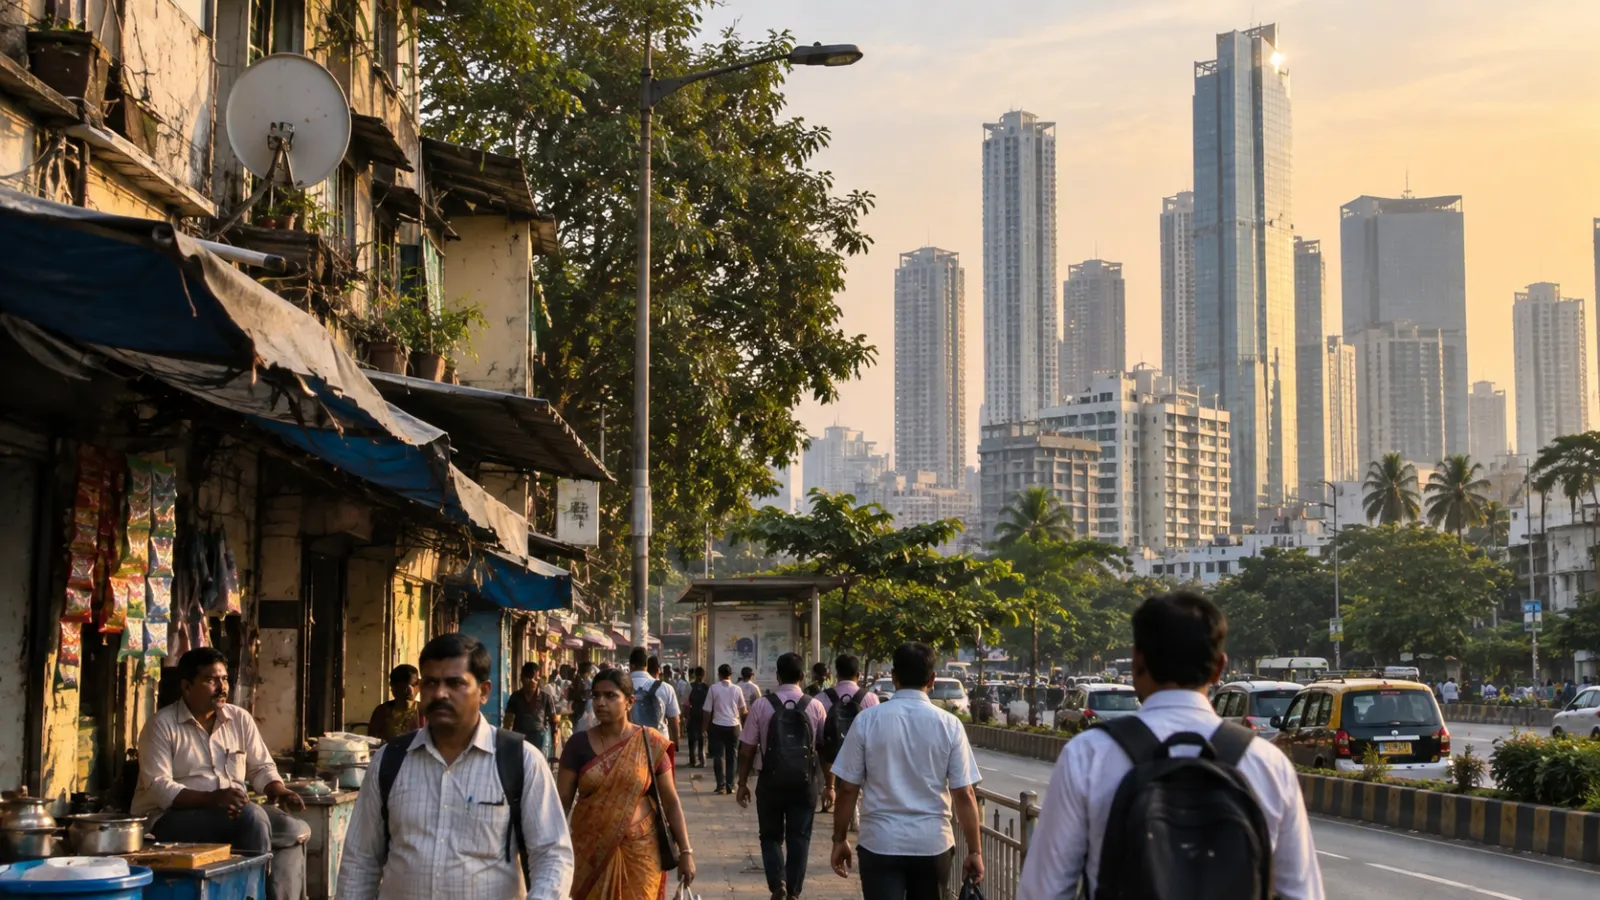
Gap Between Rich and Poor: Income, Wealth and Opportunity
The gap between rich and poor is often imagined as a single ladder of income, with households arranged from the lowest salary to the highest. In reality, economic distance has several dimensions. Income matters, but so do wealth, debt, housing, job security, access to education and healthcare, social networks and the ability to survive a period without earnings. Two households receiving similar monthly incomes can therefore occupy very different economic positions if one owns a home and substantial savings while the other has insecure work, high debt and no financial buffer.
This is why the rich–poor gap cannot be understood through salary alone. Income determines much of what a household can purchase today, while assets and institutions help determine what it can withstand tomorrow. Economic advantage can also create better options: the ability to wait for a suitable job, finance additional education, relocate, start a business or survive failure without immediate hardship.
Current international evidence reinforces this multidimensional view. The International Labour Organization’s State of Social Justice 2025 reports that the richest 1% of the global population holds about 20% of income and 38% of wealth, while large inequalities in labour-market security and informality remain. (ilo.org) The World Bank similarly argues that average income growth cannot describe whether prosperity is broadly shared and now tracks a Global Prosperity Gap alongside conventional poverty and inequality indicators. (worldbank.org)
The important analytical question is therefore not simply “How much more does the richest person earn than the poorest?” It is how economic resources translate into security, opportunity and influence—and how easily people can move from one part of the distribution to another.
Income, Wealth and Poverty Describe Different Parts of the Gap
Income is a flow. It includes wages, business earnings, pensions, transfers and investment returns received over a period. For most households, labour income remains the main source of resources, so wage differences strongly influence living standards. Education, occupation, industry, technology, bargaining power, discrimination, minimum wages, union coverage and whether work is formal or informal can all affect how earnings are distributed.
Wealth, by contrast, is a stock. It includes assets such as housing, land, businesses, savings and financial investments minus debts. Wealth is often more concentrated than income because assets can appreciate, produce investment returns and be passed between generations. It also provides insurance against shocks in a way current income alone cannot.
A household with six months of expenses in savings can approach unemployment differently from one living paycheque to paycheque. The first may spend time searching for a position that fits its skills, finance retraining or relocate to another city. The second may need to accept the first available job because rent and food cannot wait. Wealth therefore purchases time and bargaining power, not only additional consumption.
Housing illustrates this particularly clearly. For many families, a home is the largest asset they will ever own. Mortgage repayment can gradually build household equity, while rising property values may increase wealth further. Renters may receive the same housing service but do not automatically accumulate an asset through their monthly payments. Location adds another effect because housing determines access to schools, transport, healthcare and labour markets.
Debt can push the relationship in the opposite direction. Credit used to finance a productive business, education or an appreciating asset may expand future opportunity. High-cost borrowing used to pay rent, food or emergency medical expenses can consume future income without creating an asset. Two households with identical gross assets may therefore have very different net wealth if one also carries substantial liabilities.
Poverty measures another concept altogether. Poverty asks whether people have sufficient resources to meet a defined standard; inequality asks how resources are distributed across the population. A country can reduce extreme poverty while becoming more unequal if lower-income households improve but upper incomes grow much faster. Inequality can also decline during a recession because high incomes fall sharply even while poor households remain badly off.
Neither movement by itself provides a complete welfare assessment.
The World Bank has increasingly tried to capture this distinction through shared-prosperity measures. Its current Global Prosperity Gap estimates how far people are, on average, from a prosperity standard of $25 per person per day while giving greater weight to those furthest below it. The Bank reports that progress in reducing this gap stalled after the COVID-19 pandemic and that approximately one-fifth of the world’s population lives in countries classified as having high inequality under its present framework. (worldbank.org)
This does not make the Global Prosperity Gap a replacement for poverty rates, the Gini coefficient or wealth statistics. Each measure answers a different question. The appropriate indicator depends on whether the issue is basic deprivation, distribution, economic security, wealth concentration or mobility.
Opportunity Explains How Today’s Gap Can Become Tomorrow’s
Differences in income would have a different meaning if people moved easily between economic positions and if childhood circumstances had little influence on adult outcomes. In practice, family background, education, geography, health, housing and social networks can all shape opportunity before an individual enters the labour market.
The OECD’s 2025 report To Have and Have Not estimates that, on average across the countries it studied, more than one-quarter of market-income inequality can be attributed to inherited circumstances and other factors outside individual control, including parental socioeconomic background, gender and place of birth. The estimated contribution differs sharply among countries, ranging from below 15% in some to above 35% in others. (oecd.org)
Parental socioeconomic background is particularly influential. The OECD estimates that it accounts for more than 60% of measured inequality of opportunity at household level in a majority of the countries examined. This does not mean parents mechanically determine their children’s destinies. It means institutions do not completely neutralise the advantages and disadvantages children inherit.
Families transmit much more than money. They transmit neighbourhoods, language, information, professional networks, expectations and knowledge about how institutions work. A parent may know which university programme leads to a particular profession, how to approach an employer, which internships matter or how to finance a period of unpaid training. Those forms of advantage may never appear in an inheritance record but can still shape opportunity.
Education can either weaken or reproduce these differences. Strong public schools can give children from lower-income households access to skills their families could not purchase privately. But when affluent households can buy substantially better schools, tutoring, technology, extracurricular activities and university preparation, education can become one of the mechanisms through which advantage is transmitted.
Geography operates similarly. Where someone grows up affects school quality, transport, safety, environmental exposure, healthcare and proximity to jobs. A qualified person may technically be eligible for a position but unable to reach it because commuting is unreliable or unaffordable. OECD research increasingly treats place as a major component of inequality of opportunity because access to essential services and mobility-supporting institutions differs significantly between regions. (oecd.org)
Health can convert social inequality into economic inequality as well. Hazardous work, pollution, poor housing and inadequate preventive care can increase health risks among poorer households. Illness then reduces the ability to work while creating additional expenses. A health disadvantage can therefore become an income disadvantage, which in turn makes subsequent healthcare harder to afford.
This compounding process is one reason wealth inequality matters beyond the current generation. A family with savings can preserve a child’s education during temporary unemployment. It can pay a university deposit, finance relocation or absorb an unpaid internship. Another equally talented young person may be forced to reject the same opportunity because the household cannot survive without immediate earnings.
The ability to wait is therefore a largely invisible form of economic advantage.
Labour Markets, Capital and Public Institutions Shape the Distribution
Work generates much of the income received by ordinary households, so the structure of labour markets is central to the gap between rich and poor. Wage differences can reflect differences in skills and productivity, but they can also reflect bargaining power, sector, firm characteristics, job security, discrimination and institutional rules.
The ILO’s 2025 social-justice assessment notes that global labour productivity per worker has increased substantially over the long term while major inequalities in income, wealth and employment security remain. It also reports that 58% of workers globally remain in informal employment, illustrating how employment quality can differ even when individuals are economically active. (ilo.org)
Informal work is particularly relevant because annual income alone may underestimate insecurity. A worker can earn a reasonable amount during good months while lacking paid leave, unemployment insurance, pension protection or predictable contracts. Another employee with similar annual earnings may have stable hours, health benefits and strong legal protection. Economic distance therefore includes exposure to risk as well as current income.
At the upper end of the distribution, capital income can create a different dynamic. People who own shares, businesses, property or other productive assets can receive dividends, rent, interest and capital gains in addition to labour income. When returns on assets accumulate and are reinvested, wealth can compound across decades.
Inheritance then carries part of that accumulated advantage into another generation. The mechanism does not require billion-dollar estates. A paid-off house, help with university costs, a business transferred to children or a deposit for a first home can substantially change the starting position of the next generation.
Technology can widen or narrow these gaps depending on the surrounding institutions. New technology can reduce prices, expand access to information and create productive employment. It can also increase returns to scarce technical skills or to ownership of capital while replacing some routine tasks. Whether technological change produces broadly shared gains depends partly on education, competition, labour institutions and who owns the productive assets.
Public institutions can alter the distribution both after and before market income is earned. Taxes and cash transfers directly change disposable income. Healthcare, education, childcare, housing assistance and public transport influence living standards even when they do not appear as cash in a household bank account.
This creates an important measurement problem. Two households with the same disposable cash income may enjoy very different effective living standards if one has reliable public healthcare, schools and transport while another must purchase those services privately.
Public services can also change inequality of opportunity. A child does not need the same parental income to access a good education when high-quality schooling is broadly available. A serious illness is less likely to destroy household wealth when healthcare does not require catastrophic out-of-pocket spending. Affordable transport can connect low-income neighbourhoods with jobs that would otherwise be inaccessible.
These institutions do not make every outcome equal. They influence how strongly current income determines future capability.
Economic Distance Can Become Social and Political Distance
The rich–poor gap matters not only because some households can purchase more goods. Large and persistent economic differences can shape how groups experience society itself.
If affluent and lower-income households increasingly live in different neighbourhoods, attend different schools, use different healthcare systems and travel through different social networks, they may encounter entirely different public institutions. A service that appears satisfactory to one group may be failing another group that rarely interacts with it.
This separation can also affect perceptions of fairness. The United Nations World Social Report 2025 identifies economic insecurity, entrenched inequality, declining trust and social fragmentation as interconnected challenges. It reports that more than half of the global population expresses little or no trust in government and argues that insecurity and inequality can weaken solidarity and confidence in institutions. (desapublications.un.org)
This should not be interpreted as proof that income inequality alone causes distrust. Trust is influenced by governance, history, corruption, economic performance, social conflict and many other factors. The stronger point is that people are less likely to view unequal outcomes as legitimate when they believe the system does not offer meaningful mobility or when economic advantage appears politically protected.
Economic resources can also affect political influence. Wealth can finance lobbying, campaign activity, access to legal and policy expertise, media ownership or organised advocacy. The exact mechanisms differ between political systems, and affluent citizens do not automatically get every policy outcome they prefer. But the democratic concern is whether concentrated economic resources create systematically unequal ability to organise and communicate preferences.
The issue is therefore not that wealthy citizens should possess fewer political rights. It is whether all citizens have a reasonable opportunity to participate in institutions whose decisions affect them.
Gender can create another hidden layer of distribution because household-income statistics usually assume resources are shared within families. In practice, household bargaining power can affect who controls money, receives healthcare, pursues education or performs unpaid work. A household can move above an income-poverty line while significant inequality persists among the people living within it.
The same principle applies to social identity more broadly. Race, caste, ethnicity, disability or migration status can influence access to jobs, housing, credit and networks even among people with similar formal qualifications. This is one reason purely vertical measures of income distribution cannot describe every form of inequality.
The rich–poor gap can therefore become a life-chance gap, a security gap and, under some conditions, an influence gap.
Measuring the Gap Requires More Than the Gini Coefficient
The Gini coefficient is one of the most widely used measures of income or consumption inequality. A value near zero indicates a relatively equal distribution, while higher values represent greater concentration. It is useful because it compresses an entire distribution into one comparable statistic.
That strength is also its limitation.
Two countries can have the same Gini coefficient while having very different distributions. In one, the main gap may lie between very poor households and the middle. In another, the middle and bottom may be relatively close while the richest households receive an unusually large share of income. The same Gini does not tell us which pattern produced the number.
Researchers therefore use other measures alongside it. Top income or wealth shares reveal concentration at the upper end. Bottom shares show how much reaches lower-income groups. Percentile ratios compare households at different points in the distribution. Poverty rates measure how many people fall below a chosen threshold. Mobility measures examine whether parents’ economic positions strongly predict their children’s.
Market income and disposable income provide additional distinctions. Market income captures wages, business returns and capital income before government redistribution. Disposable income incorporates cash taxes and transfers. Adding publicly provided health, education and other services would change the picture again.
This is why arguments about whether inequality is “high” or “low” require clarity about what is being measured, for whom, over what period and before or after which institutions intervene.
A complete assessment should also examine persistence. A large temporary income difference may matter less when mobility is high and basic security is strong. More modest annual differences can become much more consequential when the same families remain advantaged for several generations and when wealth, education, health and geography all reinforce one another.
The rich–poor gap is therefore as much about movement as distance.
Can children from low-income families realistically reach higher positions?
Can a household recover from unemployment or illness?
Can people without family wealth finance education or entrepreneurship?
Can workers negotiate better conditions, or is bargaining power concentrated?
Do public services reduce the consequences of low income?
Those questions reveal dimensions that a single coefficient cannot.
Why the Gap Between Rich and Poor Matters
Not every difference in income or wealth is automatically evidence of injustice. People make different choices about occupations, hours, saving, consumption and risk. Skills differ, and some economic rewards provide incentives for investment, training and entrepreneurship.
The more difficult question is which inequalities arise from genuine differences in choice and contribution and which are reinforced by inherited advantage, unequal schooling, discrimination, monopoly power, geography or barriers outside individual control.
Opportunity therefore matters alongside outcome.
A society may accept significant income differences more readily when people believe positions are genuinely open, public institutions are reliable and nobody falls below an unacceptable floor. The same income distribution can be experienced differently when one society provides broad healthcare, education, pensions and unemployment protection while another exposes households to catastrophic risk.
Security matters because resources change the quality of available choices. Wealthier households can wait, experiment, relocate and recover from failure. Households without buffers often have to prioritise immediate survival even when they understand that a different decision might produce greater returns in the long run.
That ability to absorb risk is one of the least visible components of the gap between rich and poor.
The gap therefore cannot be understood simply by comparing two salaries.
A credible analysis asks several questions at once: How unequal are incomes? How concentrated is wealth? How much debt do households carry? How secure is employment? How strongly does parental background shape opportunity? Can public institutions offset low private resources? Can people move between economic positions, or are advantages becoming increasingly inherited?
The goal is not to assume that every economic difference should disappear.
It is to identify when differences cease to reflect varied choices and begin to harden into separate levels of security, opportunity and influence.
That is why the gap between rich and poor matters. Money affects consumption, but economic resources also influence where people can live, how long they can wait, which risks they can take, how easily they can recover and what opportunities they can pass to the next generation.
The distance between rich and poor is therefore not merely a gap in what people own today.
It is also a gap in how much freedom they have to shape tomorrow.